COVID-19 Geography
Use this report to view encounters geographically. When you first view this report, you see a view of all encounters in the United States.
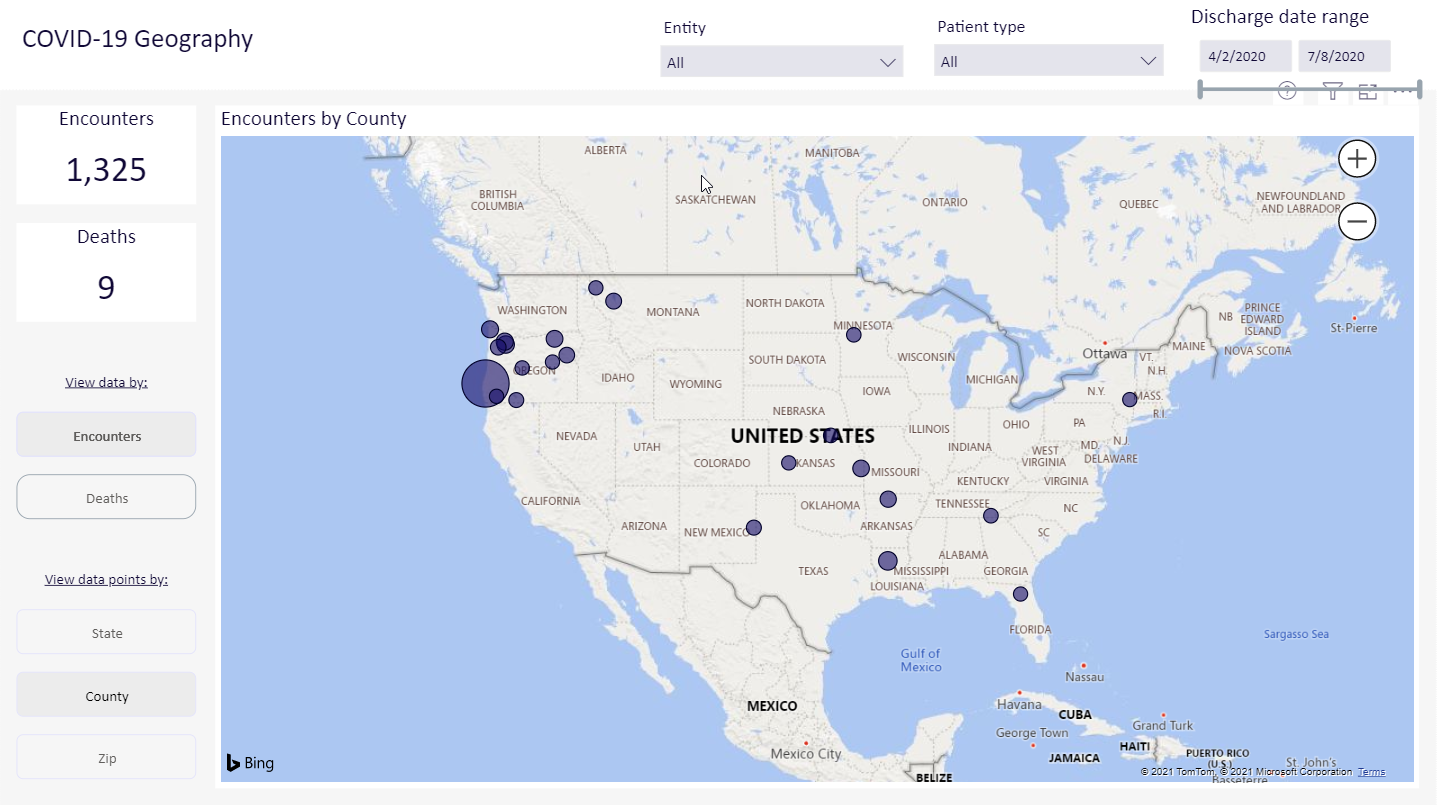
Click image to view full size
Slicers
This report provides filtering options that let you create a set of data, giving you the option of viewing the precise data you want to view.
Patient type
The patient drops-down lists the ways a patient was seen, such as inpatient or outpatient emergency. The list will show the patient types used in your organization.
Discharge date range
This control lets you select a range of dates of discharge. You can use the slider or, for more precision, click on each date box to choose a date from a calendar.
TIP: Use the dashboard tools to view, export, and sort the data; view data as table; and more.
Viewing Encounter data
Once you have defined the patient population you are interested in, you can now choose how you want to view that patient populations geographically. These options let you examine clusters for a patient population.
View data by:
You can choose to view all of the encounters in your patient population or view only the deaths.
View data points by:
These options let you drill down geographically on the map. Starting with the default view of the United States, you can view your patient population by state, county, or ZIP code.
Navigation
-
Use the tabs at the bottom of the page to view other related reports in the category
-
Use the Navigation menu in the upper-left corner to return to Recent places that you've visited or to the Intelligence Center.